
Creating Random-Dot Stereograms with PowerPoint
1 September 2026
Random-Dot Stereograms, developed by Béla Julesz in the 1970s (for an autobiographical perspective, in dialogue format – something relatively uncommon in the scientific literature on Psychology – see Julesz, 1995), constitute one of the principal and most compelling demonstrations that stereopsis does not require prior information about shapes and contours (and therefore must be resolved at the level of individual dots; cf. Palmer, 1999). For this reason, they are an indispensable resource for any class on binocular perception. Moreover, constructing a Random-Dot Stereogram is based on principles that are considerably simple and can be recreated without sophisticated tools. This tutorial explains, step by step, how to create a Random-Dot Stereogram using only PowerPoint (here we used versiopn 2608 of Microsoft Office 365, for Windows, but the instructions should be easilly followed on other versions as well). It can therefore be used either to prepare teaching material quickly and in advance for a class on stereoscopic perception or adapted as an exercise to be carried out in class.
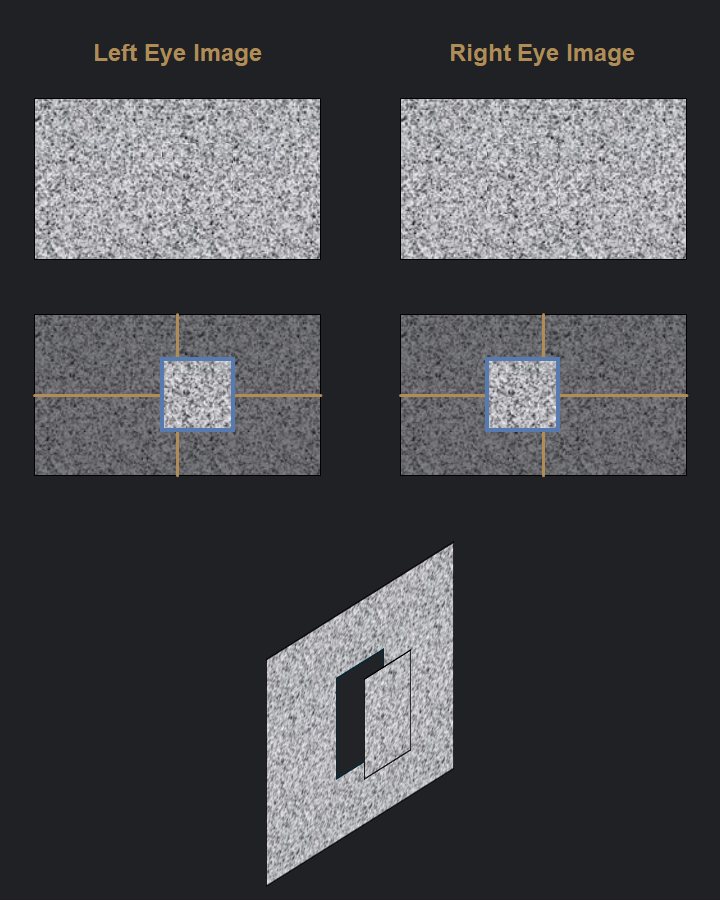
The underlying logic of Random-Dot Stereograms consists in recreating binocular disparities in a random pattern (classically, randomly positioned white or black dots). That is, the same portion of an image containing a random pattern is spatially shifted to the left or right in the images presented to the left or right eye, as illustrated in Figure 1. At the top is the Random-Dot Stereogram itself: the two images, to be presented separately to each eye, contain no contours or shapes and appear to be similar images made up of a random pattern. However, as schematised in the images in the centre, a square portion (outlined in blue) is shifted slightly to the right in the image presented to the left eye and to the left in the image presented to the right eye (the gold reference lines correspond to the horizontal and vertical midlines of the image). This difference corresponds to a crossed binocular disparity and, insofar as stereoscopic perception is able to resolve the disparity without prior monocular identification of shapes and/or contours, the square section should appear to be closer to the observer when the two images are presented to the respective eyes (as illustrated at the bottom). As the reader will be able to see by the end of this tutorial, this is exactly what happens, demonstrating that the correspondence problem in binocular perception (i.e. determining which parts of the two eyes' optical images correspond to one another) is solved at the level of individual dots (rather than lines and/or contours) in the optical image.
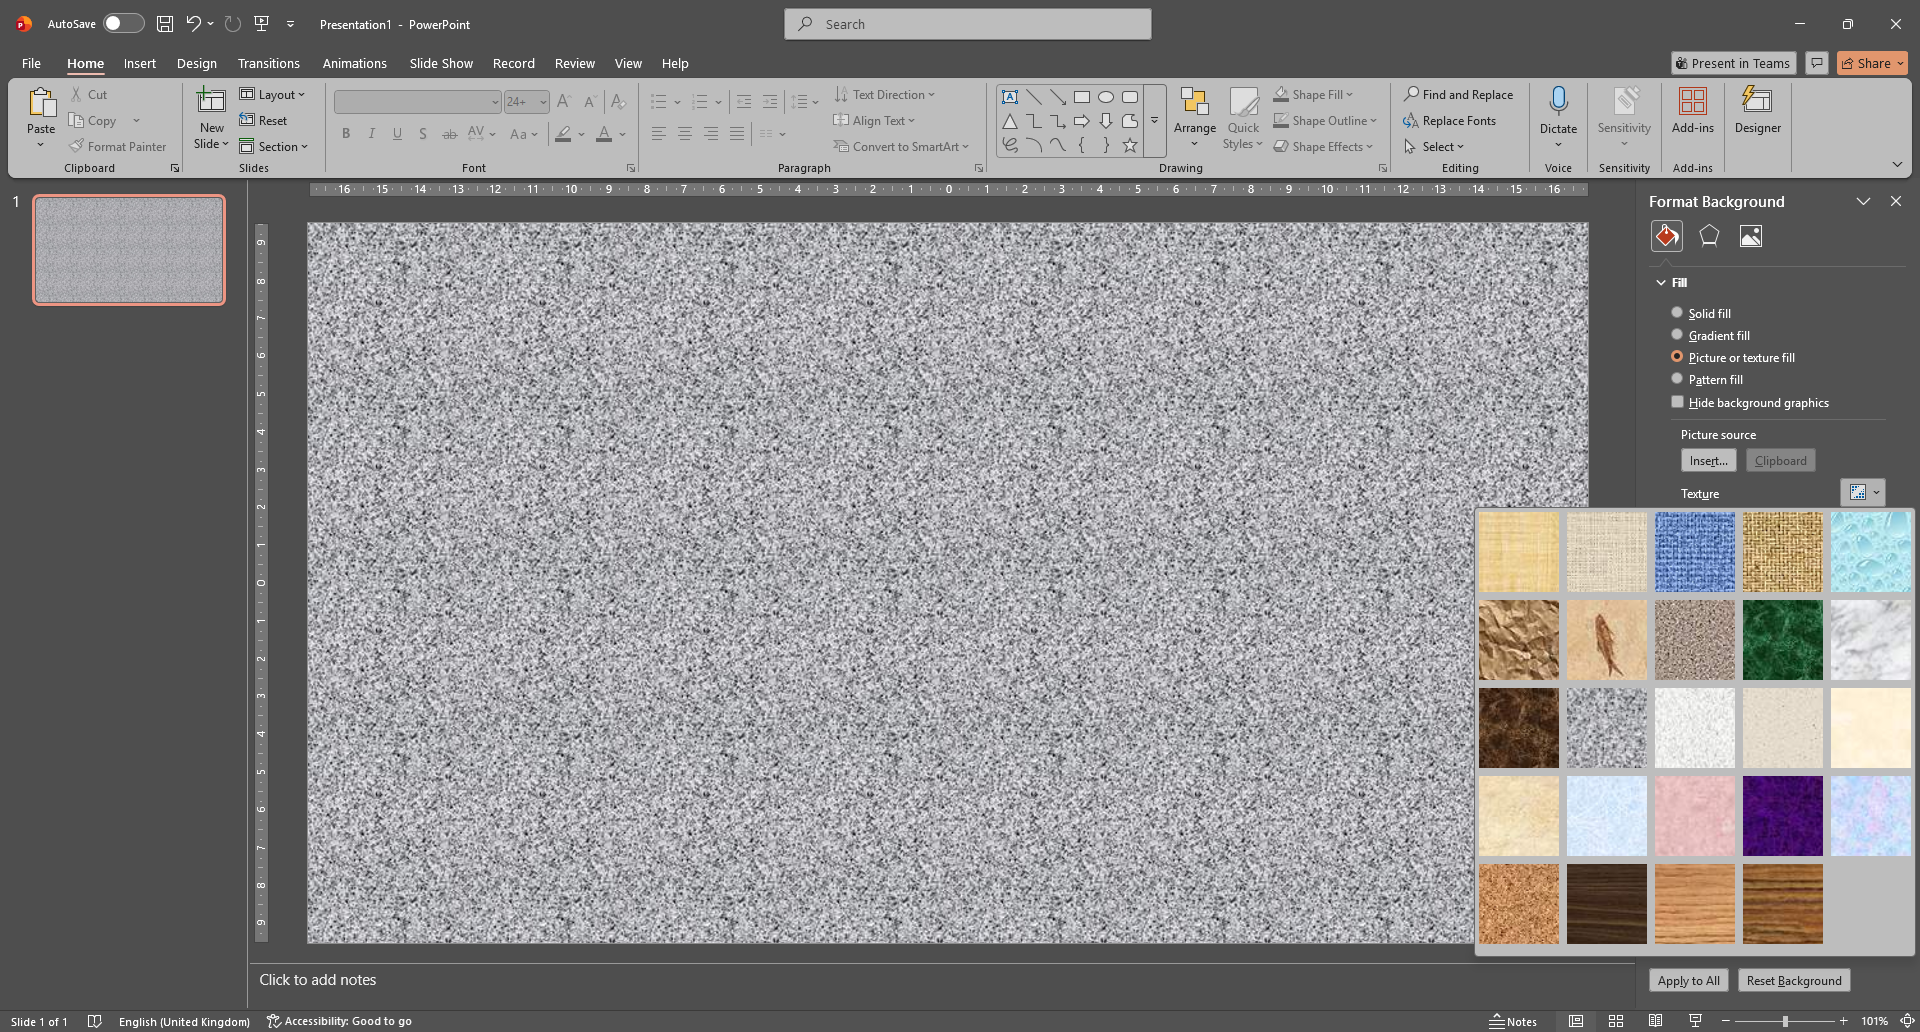
To construct a Random-Dot Stereogram, we first need to define, in a new file, a background pattern for the slides. To do this, right-click on the blank slide area and select the "Format Background" option from the contextual menu. The "Format Background" pane should open on the right-hand side of the screen. There, select the "Picture or texture fill" option. You can either specify an image file (e.g. an image containing random black and white dots; see below how to generate such an image with MATLAB) or simply select one of the options available under "Texture" (see Figure 2). From the latter, choose a texture that is relatively free of obvious visual forms (such as, for example, the texture depicting fish fossils). A good option is the "granite" or "newsprint" texture. Before proceeding, make sure that the "Tile picture as texture" option is selected (otherwise, the source image will be distorted to fill the entire slide). The remaining options can be left at their default values (X and Y offsets of 0 pt, X and Y scales of 100%, any alignment and mirror type [these last two options are irrelevant for our purposes]).
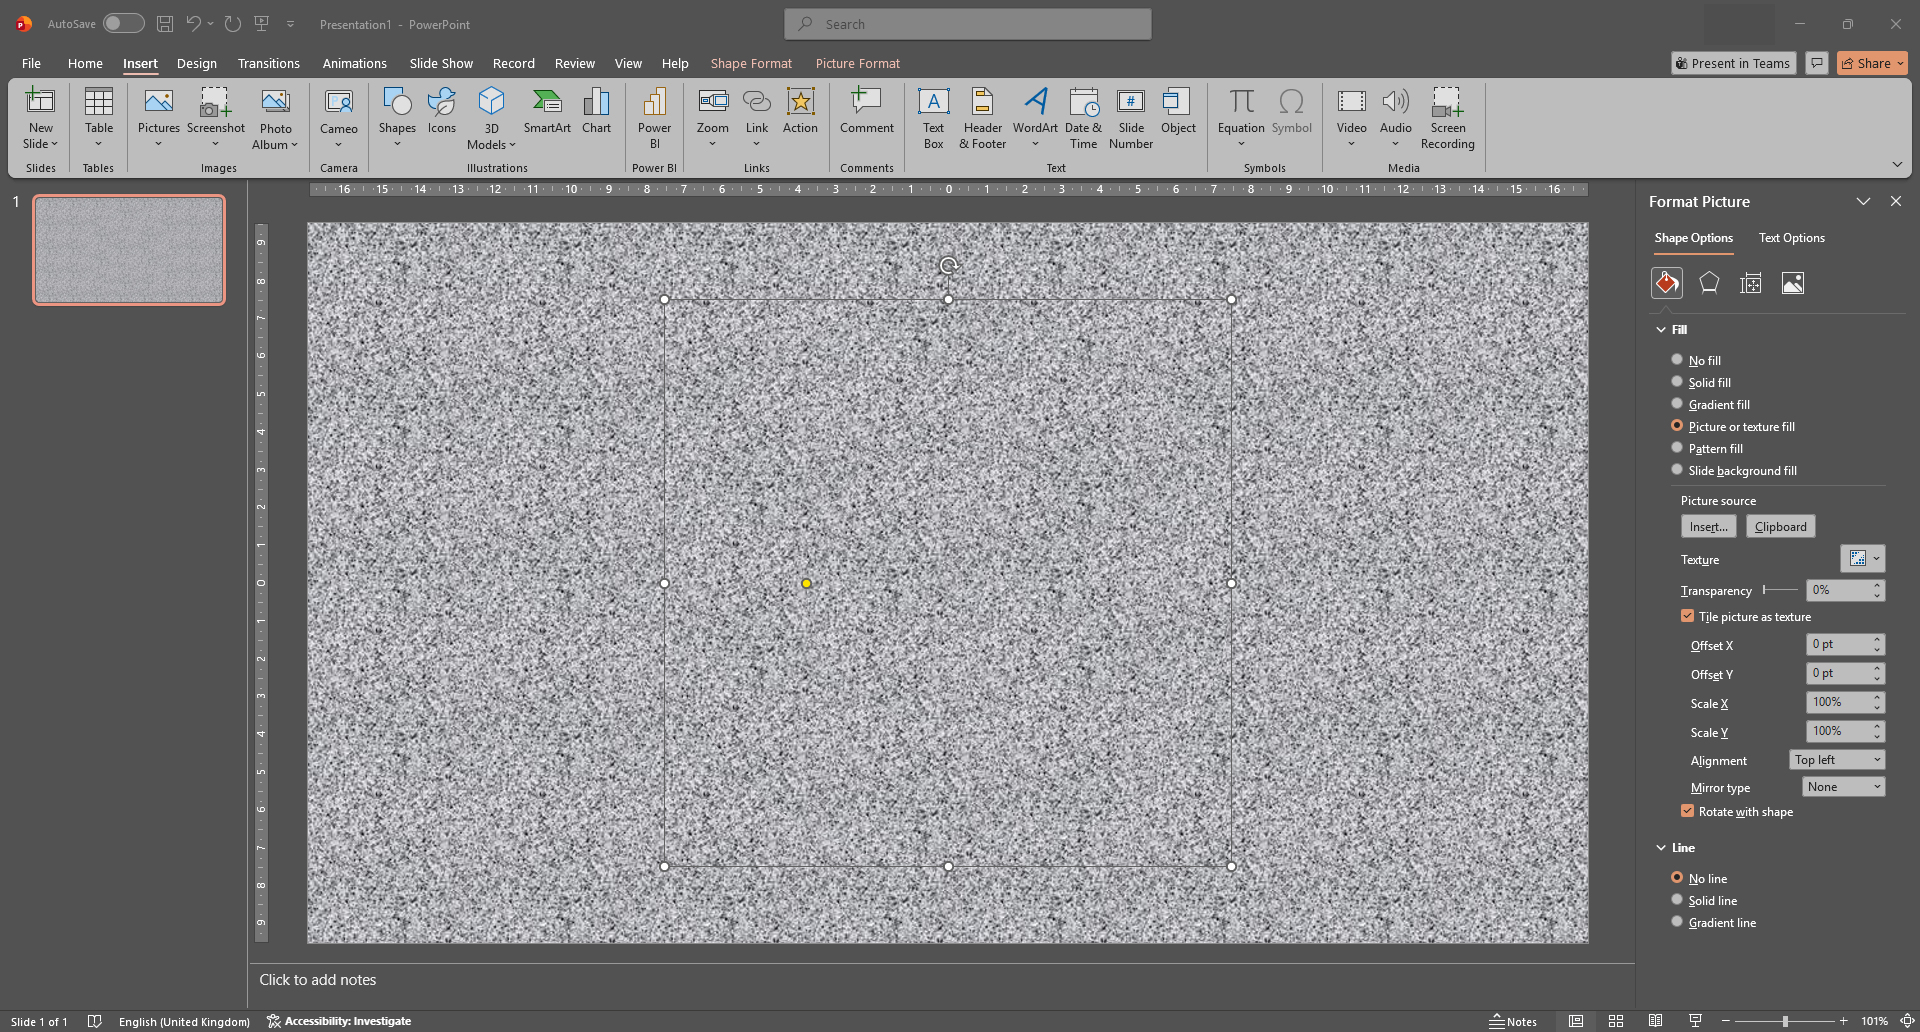
Next, insert any shape (the "Shapes" option under the "Insert" menu) onto the slide, at any location you wish (ideally, it should be near the centre and of medium size). With the chosen shape selected, right-click on it and select the "Format Shape" option from the contextual menu (this step will probably be unnecessary if the side pane on the right-hand side of the slide is still open, but if it has been closed, it is included here for completeness). As with the background, specify that the fill (under the corresponding menu) of the selected shape is a "Picture or texture fill". Now select exactly the same texture as the one chosen for the background (e.g. granite) and, once again, make sure that the "Tile picture as texture" option is selected. Finally, under "Line", select the "No line" option. The result should be similar to that shown in Figure 3: the chosen shape should be imperceptible.
The present slide already constitutes part of the Random-Dot Stereogram. Specifically, it will be the image shown to the left eye. For the image to be shown to the right eye, we begin by duplicating the present slide: select the slide in the menu on the left-hand side (simply left-click on its thumbnail) and press CTRL+D (or, if you prefer to use PowerPoint's visual interface, select the "Duplicate Selected Slides" option under the "New Slide" button in the "Home" menu). On this new slide, the inserted shape should be moved slightly to the left (if you want it to appear closer to the observer in the stereogram – crossed disparity) or to the right (if you want it to appear further away from the observer in the stereogram, resulting in the perception of a hole with the selected shape – uncrossed disparity). This should not be done simply by dragging the shape with the mouse, as finer control is required here. The best option is simply to select the shape (by left-clicking on it) and press the appropriate arrow key on the keyboard (left arrow or right arrow). The amount of displacement, which can be controlled by the number of times the key is pressed, should not be excessive, as there is a risk of exceeding the limit of stereoscopic fusion. As a rule, pressing the left (or right) arrow key between 5 and 10 times should be sufficient. Naturally, the more times the key is pressed, the further the shape moves and the greater the binocular disparity. For example, pressing the left arrow key ten times will result in the perception that the shape is closer to the observer than if the same key is pressed only two or three times. This can be used to create somewhat more complex stereograms, with several shapes at different depths. To do this, insert more than one shape, with the perceived depth controlled by the key used to move the shape (left or right arrow) and the number of times it is pressed.
Finally, each slide should be saved as an image file. To do this, go to the "File" menu and select "Save As". Now select "Browse" and, after choosing the destination, select "JPEG File Interchange Format (*.jpg)" from the "Save as type" field (immediately below the "File name" field). When you click Save, a dialogue box should appear in which you can specify which slides to export. Assuming that only the two slides just created exist, select the "All Slides" option.
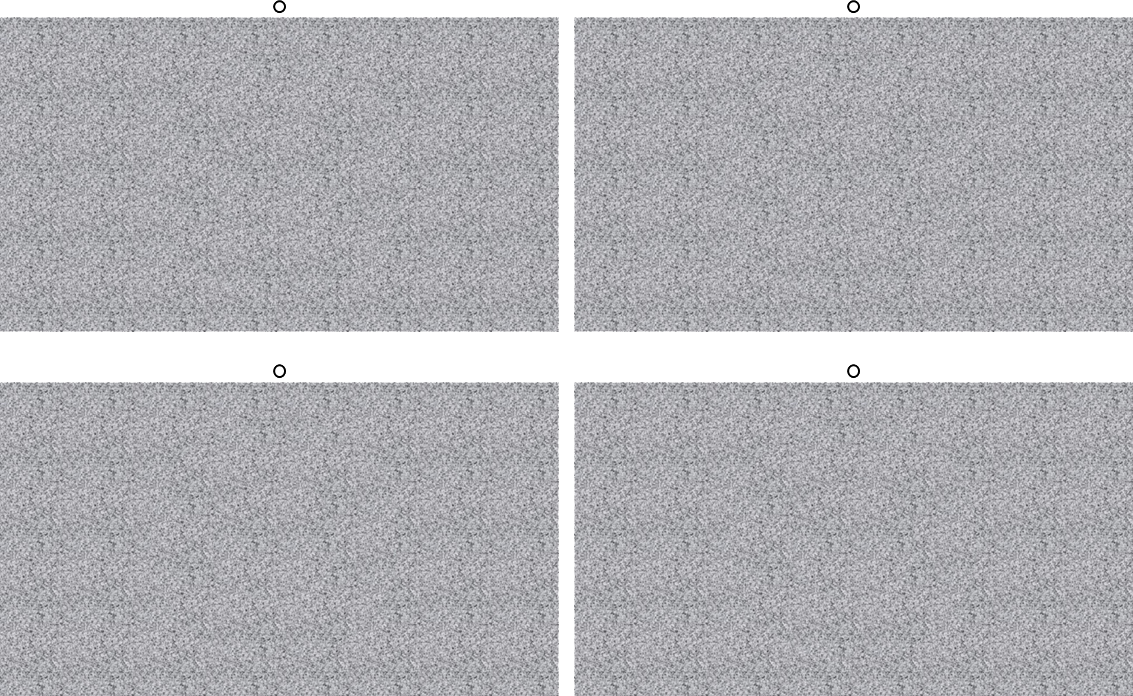
The two images generated can now be viewed using a stereoscopic viewing technique, such as anaglyphs, or placed side by side, with reference points above them, for parallel viewing (slide 1 on the left; the observer should focus on a point beyond the plane of the image until the two images fuse) or cross-eyed viewing (slide 1 on the right; the observer should focus on a point in front of the plane of the image, crossing their eyes, until the two images fuse), as shown in Figure 4. The parallel-fusion version is shown at the top and the crossed-fusion version at the bottom.
Generating a random-dot image in MATLAB
If one wishes to generate a Random Dot Stereogram in the strict sense of the term, a randomly arranged pattern of black and white dots should be used instead of the textures available in PowerPoint. The quickest and most effective way to do this is by using MATLAB.
Begin by entering the following command in the MATLAB command window:
A = randi([0 1], 1080, 1920);
This command generates a 1920 × 1080-cell matrix, made up of randomly arranged 0s and 1s. The dimensions of the matrix can be adjusted as needed – in this case, the dimensions used correspond to a typical computer screen resolution, in pixels. The larger/smaller the matrix, the smaller/larger the dots in the resulting image will be.
The values 0 and 1 must now be converted to 0 and 255, respectively, to reflect the intensity, in bytes, of the pixels in the image to be generated:
A = A * 255;
Finally, the matrix must be converted to the uint8 data type, so that it can be exported directly as an image:
A = uint8(A);
To save the matrix of random dots as an image (in .jpg format), so that it can be used in PowerPoint instead of the available textures, enter the following command, replacing the term NAME with your desired filename:
imwrite(A,'NAME.JPG')
Bibliography
-
Julesz, B. (1995). Dialogues on Perception. The MIT Press.
-
Palmer, S. E. (1999). Vision Science: Photons to Phenomenology. The MIT Press.